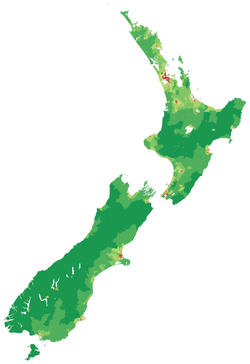
Dieser Artikel listet die städtischen Gebiete Neuseelands – gemäß der Definition von Statistics New Zealand – nach Einwohnerzahl auf. Die 150 größten städtischen Gebiete sind aufgeführt. Die Definition städtischer Gebiete entspricht dem Statistical Standard for Geographic Areas 2018 (SSGA18).
Die Tabelle ist standardmäßig nach der Bevölkerungszahl im Juni 2025 sortiert.
| # | Name | Region | Bevölkerung | Wachstum | |||
|---|---|---|---|---|---|---|---|
| Voraussichtlich Juni 2025 [ 1 ] | Volkszählung 2023 [ 2 ] | Volkszählung 2018 [ 2 ] | 2023 – Juni 2025 | 2018–2023 | |||
| 1 | Auckland | Auckland | 1.547.200 | 1.402.275 | 1.345.833 | +10,33 % | +4,19 % |
| 2 | Christchurch | Canterbury | 407.800 | 380.079 | 358.068 | +7,29 % | +6,15 % |
| 3 | Wellington | Wellington | 209.800 | 201.708 | 201.792 | +4,01 % | −0,04 % |
| 4 | Hamilton | Waikato | 192.100 | 174.741 | 160.911 | +9,93 % | +8,59 % |
| 5 | Tauranga | Bay of Plenty | 160.900 | 152.790 | 137.130 | +5,31 % | +11,42 % |
| 6 | Lower Hutt | Wellington | 113.200 | 106.530 | 103.545 | +6,26 % | +2,88 % |
| 7 | Dunedin | Otago | 104.000 | 100.908 | 99.885 | +3,06 % | +1,02 % |
| 8 | Palmerston North | Manawatū-Whanganui | 81.200 | 78.021 | 76.281 | +4,07 % | +2,28 % |
| 9 | Hibiskusküste | Auckland | 67.800 | 63.351 | 53.730 | +7,02 % | +17,91 % |
| 10 | Napier | Hawke's Bay | 66.400 | 64.695 | 62.241 | +2,64 % | +3,94 % |
| 11 | Neu-Plymouth | Taranaki | 60.200 | 58.047 | 54.279 | +3,71 % | +6,94 % |
| 12 | Porirua | Wellington | 60.100 | 58.080 | 55.218 | +3,48 % | +5,18 % |
| 13 | Rotorua | Bay of Plenty | 58.500 | 55.326 | 54.186 | +5,74 % | +2,10 % |
| 14 | Whangārei | Nordland | 56.100 | 53.841 | 51.894 | +4,20 % | +3,75 % |
| 15 | Invercargill | Südland | 51.200 | 48.987 | 47.844 | +4,52 % | +2,39 % |
| 16 | Nelson | Nelson | 50.800 | 49.224 | 48.129 | +3,20 % | +2,28 % |
| 17 | Hastings | Hawke's Bay | 49.800 | 47.682 | 45.075 | +4,44 % | +5,78 % |
| 18 | Upper Hutt | Wellington | 44.500 | 42.903 | 41.301 | +3,72 % | +3,88 % |
| 19 | Whanganui | Manawatū-Whanganui | 42.800 | 41.481 | 39.777 | +3,18 % | +4,28 % |
| 20 | Gisborne | Gisborne | 38.100 | 36.912 | 34.644 | +3,22 % | +6,55 % |
| 21 | Rolleston | Canterbury | 34.100 | 28.449 | 17.541 | +19,86 % | +62,19 % |
| 22 | Paraparaumu | Wellington | 29.900 | 28.938 | 28.701 | +3,32 % | +0,83 % |
| 23 | Blenheim | Marlborough | 29.800 | 28.788 | 27.648 | +3,52 % | +4,12 % |
| 24 | Timaru | Canterbury | 29.300 | 28.095 | 27.501 | +4,29 % | +2,16 % |
| 25 | Queenstown | Otago | 29.000 | 25.050 | 20.346 | +15,77 % | +23,12 % |
| 26 | Pukekohe | Auckland | 28.800 | 27.042 | 23.841 | +6,50 % | +13,43 % |
| 27 | Taupō | Waikato | 27.000 | 25.374 | 23.622 | +6,41 % | +7,42 % |
| 28 | Cambridge | Waikato | 22.700 | 21.366 | 18.681 | +6,24 % | +14,37 % |
| 29 | Masterton | Wellington | 22.600 | 21.606 | 19.917 | +4,60 % | +8,48 % |
| 30 | Ashburton | Canterbury | 21.600 | 20.346 | 19.356 | +6,16 % | +5,11 % |
| 31 | Levin | Manawatū-Whanganui | 20.500 | 19.533 | 17.775 | +4,95 % | +9,89 % |
| 32 | Richmond | Tasman | 19.950 | 18.447 | 15.378 | +8,15 % | +19,96 % |
| 33 | Rangiora | Canterbury | 19.300 | 18.855 | 17.898 | +2,36 % | +5,35 % |
| 34 | Feilding | Manawatū-Whanganui | 17.650 | 16.929 | 15.990 | +4,26 % | +5,87 % |
| 35 | Whakatāne | Bay of Plenty | 16.950 | 16.419 | 15.795 | +3,23 % | +3,95 % |
| 36 | Mosgiel | Otago | 15.100 | 14.589 | 13.656 | +3,50 % | +6,83 % |
| 37 | Havelock North | Hawke's Bay | 15.000 | 15.003 | 14.391 | −0,02 % | +4,25 % |
| 38 | Tokoroa | Waikato | 14.500 | 14.001 | 13.572 | +3,56 % | +3,16 % |
| 39 | Oamaru | Otago | 14.300 | 13.680 | 13.065 | +4,53 % | +4,71 % |
| 40 | Te Awamutu | Waikato | 13.950 | 13.380 | 12.543 | +4,26 % | +6,67 % |
| 41 | Kaiapoi | Canterbury | 13.700 | 13.017 | 11.853 | +5,25 % | +9,82 % |
| 42 | Waikanae | Wellington | 13.600 | 12.966 | 12.099 | +4,89 % | +7,17 % |
| 43 | Wānaka | Otago | 13.200 | 11.922 | 9.555 | +10,72 % | +24,77 % |
| 44 | Lincoln | Canterbury | 12.100 | 10.611 | 6.522 | +14,03 % | +62,70 % |
| 45 | Hāwera | Taranaki | 10.700 | 10.365 | 9.792 | +3,23 % | +5,85 % |
| 46 | Te Puke | Bay of Plenty | 10.400 | 9.114 | 8.631 | +14,11 % | +5,60 % |
| 47 | Waiuku | Auckland | 9.860 | 9.531 | 9.273 | +3,45 % | +2,78 % |
| 48 | Morrinsville | Waikato | 9.770 | 9.003 | 7.893 | +8,52 % | +14,06 % |
| 49 | Matamata | Waikato | 9.540 | 9.132 | 8.043 | +4,47 % | +13,54 % |
| 50 | Graumaul | Westküste | 8.610 | 8.337 | 7.965 | +3,27 % | +4,67 % |
| 51 | Ngāruawāhia | Waikato | 8.570 | 7.992 | 6.987 | +7,23 % | +14,38 % |
| 52 | Huntly | Waikato | 8.550 | 8.232 | 7.947 | +3,86 % | +3,59 % |
| 53 | Kerikeri | Nordland | 8.380 | 8.070 | 7.185 | +3,84 % | +12,32 % |
| 54 | Beachlands-Pine Harbour | Auckland | 8.330 | 7.797 | 6.261 | +6,84 % | +24,53 % |
| 55 | Blut | Südland | 8.310 | 8.181 | 7.908 | +1,58 % | +3,45 % |
| 56 | Motueka | Tasman | 8.290 | 8.190 | 7.998 | +1,22 % | +2,40 % |
| 57 | Kumeū - Huapai | Auckland | 8.270 | 6.948 | 3.480 | +19,03 % | +99,66 % |
| 58 | Waiheke-Insel | Auckland | 8.160 | 7.998 | 7.959 | +2,03 % | +0,49 % |
| 59 | Waitara | Taranaki | 7.720 | 7.509 | 7.005 | +2,81 % | +7,19 % |
| 60 | Kawerau | Bay of Plenty | 7.680 | 7.539 | 7.146 | +1,87 % | +5,50 % |
| 61 | Cromwell | Otago | 7.470 | 6.783 | 5.610 | +10,13 % | +20,91 % |
| 62 | Pōkeno | Waikato | 7.380 | 6.081 | 2.619 | +21,36 % | +132,19 % |
| 63 | Themse | Waikato | 7.230 | 7.212 | 7.344 | +0,25 % | −1,80 % |
| 64 | Warkworth | Auckland | 7.080 | 6.675 | 5.586 | +6,07 % | +19,50 % |
| 65 | Stratford | Taranaki | 6.430 | 6.330 | 5.886 | +1,58 % | +7,54 % |
| 66 | Kaitaia | Nordland | 6.170 | 5.955 | 5.868 | +3,61 % | +1,48 % |
| 67 | Whitianga | Waikato | 6.140 | 6.054 | 5.493 | +1,42 % | +10,21 % |
| 68 | Tuakau | Waikato | 6.090 | 5.736 | 5.103 | +6,17 % | +12,40 % |
| 69 | Katikati | Bay of Plenty | 6.030 | 5.580 | 5.136 | +8,06 % | +8,64 % |
| 70 | Carterton | Wellington | 5.930 | 5.859 | 5.343 | +1,21 % | +9,66 % |
| 71 | Alexandra | Otago | 5.860 | 5.589 | 5.475 | +4,85 % | +2,08 % |
| 72 | Waihi | Waikato | 5.850 | 5.682 | 5.409 | +2,96 % | +5,05 % |
| 73 | Ōmokoroa | Bay of Plenty | 5.800 | 5.451 | 3.288 | +6,40 % | +65,78 % |
| 74 | Prebbleton | Canterbury | 5.750 | 5.382 | 4.518 | +6,84 % | +19,12 % |
| 75 | Marton | Manawatū-Whanganui | 5.730 | 5.598 | 5.229 | +2,36 % | +7,06 % |
| 76 | Dannevirke | Manawatū-Whanganui | 5.640 | 5.580 | 5.505 | +1,08 % | +1,36 % |
| 77 | Woodend | Canterbury | 5.470 | 4.542 | 2.829 | +20,43 % | +60,55 % |
| 78 | Ngongotahā | Bay of Plenty | 5.280 | 5.124 | 4.869 | +3,04 % | +5,24 % |
| 79 | Ōtaki | Wellington | 5.260 | 5.025 | 4.608 | +4,68 % | +9,05 % |
| 80 | Dargaville | Nordland | 5.170 | 5.016 | 4.827 | +3,07 % | +3,92 % |
| 81 | Taumarunui | Manawatū-Whanganui | 4.940 | 4.821 | 4.710 | +2,47 % | +2,36 % |
| 82 | Ōpōtiki | Bay of Plenty | 4.900 | 4.839 | 4.791 | +1,26 % | +1,00 % |
| 83= | Picton | Marlborough | 4.850 | 4.812 | 4.587 | +0,79 % | +4,91 % |
| 83= | Te Kūiti | Waikato | 4.850 | 4.659 | 4.572 | +4,10 % | +1,90 % |
| 85 | Temuka | Canterbury | 4.760 | 4.593 | 4.467 | +3,64 % | +2,82 % |
| 86 | Waipukurau | Hawke's Bay | 4.750 | 4.698 | 4.416 | +1,11 % | +6,39 % |
| 87 | Te Aroha | Waikato | 4.730 | 4.650 | 4.551 | +1,72 % | +2,18 % |
| 88= | Kaikohe | Nordland | 4.720 | 4.563 | 4.455 | +3,44 % | +2,42 % |
| 88= | Wairoa | Hawke's Bay | 4.720 | 4.707 | 4.527 | +0,28 % | +3,98 % |
| 90= | Paeroa | Waikato | 4.600 | 4.458 | 4.269 | +3,19 % | +4,43 % |
| 90= | Westport | Westküste | 4.600 | 4.527 | 4.392 | +1,61 % | +3,07 % |
| 92 | Putāruru | Waikato | 4.560 | 4.455 | 4.314 | +2,36 % | +3,27 % |
| 93 | Balclutha | Otago | 4.460 | 4.347 | 4.110 | +2,60 % | +5,77 % |
| 94 | Pegasus | Canterbury | 4.260 | 3.915 | 2.637 | +8,81 % | +48,46 % |
| 95 | Whangamatā | Waikato | 4.230 | 4.269 | 4.074 | −0,91 % | +4,79 % |
| 96 | Inglewood | Taranaki | 3.970 | 3.801 | 3.555 | +4,45 % | +6,92 % |
| 97 | Tūrangi | Waikato | 3.960 | 3.792 | 3.444 | +4,43 % | +10,10 % |
| 98 | Raglan | Waikato | 3.910 | 3.717 | 3.327 | +5,19 % | +11,72 % |
| 99 | Riverhead | Auckland | 3.840 | 3.558 | 2.724 | +7,93 % | +30,62 % |
| 100 | Kihikihi | Waikato | 3.820 | 3.456 | 2.754 | +10,53 % | +25,49 % |
| 101 | Te Kauwhata | Waikato | 3.780 | 3.303 | 2.118 | +14,44 % | +55,95 % |
| 102 | Snells Beach | Auckland | 3.750 | 3.678 | 3.405 | +1,96 % | +8,02 % |
| 103 | Waimate | Canterbury | 3.610 | 3.591 | 3.456 | +0,53 % | +3,91 % |
| 104 | Darfield | Canterbury | 3.590 | 3.249 | 2.784 | +10,50 % | +16,70 % |
| 105 | Helensville | Auckland | 3.540 | 3.279 | 2.820 | +7,96 % | +16,28 % |
| 106 | Foxton | Manawatū-Whanganui | 3.520 | 3.384 | 3.141 | +4,02 % | +7,74 % |
| 107 | Hokitika | Westküste | 3.420 | 3.267 | 3.096 | +4,68 % | +5,52 % |
| 108= | Ashhurst | Manawatū-Whanganui | 3.350 | 3.237 | 2.934 | +3,49 % | +10,33 % |
| 108= | Ein Baumpunkt | Nordland | 3.350 | 2.988 | 2.217 | +12,12 % | +34,78 % |
| 110 | Ōtorohanga | Waikato | 3.240 | 3.180 | 3.027 | +1,89 % | +5,05 % |
| 111 | Lyttelton | Canterbury | 3.220 | 3.123 | 2.982 | +3,11 % | +4,73 % |
| 112= | Geraldine | Canterbury | 3.070 | 3.018 | 2.883 | +1,72 % | +4,68 % |
| 112= | Ōhope | Bay of Plenty | 3.070 | 3.033 | 3.177 | +1,22 % | −4,53 % |
| 114 | Te Anau | Südland | 2.920 | 2.751 | 2.574 | +6,14 % | +6,88 % |
| 115 | Ruakākā | Nordland | 2.890 | 2.817 | 2.586 | +2,59 % | +8,93 % |
| 116= | Amberley | Canterbury | 2.870 | 2.520 | 2.070 | +13,89 % | +21,74 % |
| 116= | Featherston | Wellington | 2.870 | 2.793 | 2.487 | +2,76 % | +12,30 % |
| 118 | Arrowtown | Otago | 2.860 | 2.838 | 2.853 | +0,78 % | −0,53 % |
| 119 | Greytown | Wellington | 2.840 | 2.772 | 2.466 | +2,45 % | +12,41 % |
| 120 | Pahiatua | Manawatū-Whanganui | 2.830 | 2.838 | 2.682 | −0,28 % | +5,82 % |
| 121 | Mangawhai-Köpfe | Nordland | 2.760 | 2.685 | 1.995 | +2,79 % | +34,59 % |
| 122 | Wakefield | Tasman | 2.730 | 2.694 | 2.448 | +1,34 % | +10,05 % |
| 123 | West Melton | Canterbury | 2.700 | 2.409 | 1.971 | +12,08 % | +22,22 % |
| 124 | Maraetai | Auckland | 2.660 | 2.553 | 2.346 | +4,19 % | +8,82 % |
| 125 | Waihi Beach-Bowentown | Bay of Plenty | 2.620 | 2.550 | 2.484 | +2,75 % | +2,66 % |
| 126 | Winton | Südland | 2.560 | 2.475 | 2.337 | +3,43 % | +5,91 % |
| 127 | Lake Hāwea | Otago | 2.500 | 2001 | 1.200 | +24,94 % | +66,75 % |
| 128= | Leeston | Canterbury | 2.470 | 2.271 | 2.208 | +8,76 % | +2,85 % |
| 128= | Renwick | Marlborough | 2.470 | 2.448 | 2.418 | +0,90 % | +1,24 % |
| 130 | Waipawa | Hawke's Bay | 2.430 | 2.334 | 2.085 | +4,11 % | +11,94 % |
| 131 | Kaikōura | Canterbury | 2.350 | 2.316 | 2.223 | +1,47 % | +4,18 % |
| 132 | Brightwater | Tasman | 2.330 | 2.280 | 2.133 | +2,19 % | +6,89 % |
| 133 | Oxford | Canterbury | 2.250 | 2.235 | 2.214 | +0,67 % | +0,95 % |
| 134 | Ōtaki Strand | Wellington | 2.230 | 2.145 | 1.818 | +3,96 % | +17,99 % |
| 135 | Foxton Beach | Manawatū-Whanganui | 2.190 | 2.130 | 1.884 | +2,82 % | +13,06 % |
| 136 | Methven | Canterbury | 2.170 | 1.977 | 1.779 | +9,76 % | +12,25 % |
| 137= | Eltham | Taranaki | 2.120 | 2.097 | 1.947 | +1,10 % | +7,70 % |
| 137= | Milton | Otago | 2.120 | 2.121 | 2.157 | −0,05 % | −1,67 % |
| 139= | Bullen | Manawatū-Whanganui | 2.110 | 2.055 | 1.935 | +2,68 % | +6,20 % |
| 139= | Wellsford | Auckland | 2.110 | 2.037 | 1.974 | +3,58 % | +3,19 % |
| 141 | Clive | Hawke's Bay | 2.040 | 1.992 | 1.887 | +2,41 % | +5,56 % |
| 142 | Moerewa | Nordland | 1.930 | 1.845 | 1.737 | +4,61 % | +6,22 % |
| 143 | Murupara | Bay of Plenty | 1.910 | 1.884 | 1.815 | +1,38 % | +3,80 % |
| 144 | Martinborough | Wellington | 1.900 | 1.875 | 1.824 | +1,33 % | +2,80 % |
| 145 | Edgecumbe | Bay of Plenty | 1.890 | 1.800 | 1.644 | +7,22 % | +9,49 % |
| 146 | Bluff | Südland | 1.840 | 1.797 | 1.797 | +2,39 % | 0,00 % |
| 147 | Twizel | Canterbury | 1.790 | 1.674 | 1.515 | +6,93 % | +10,50 % |
| 148= | Coromandel | Waikato | 1.780 | 1.782 | 1.743 | −0,11 % | +2,24 % |
| 148= | Ōakura | Taranaki | 1.780 | 1.764 | 1.539 | +3,74 % | +14,62 % |
| 150 | Paekākāriki | Wellington | 1.740 | 1.674 | 1.746 | +3,94 % | −4,12 % |
Siehe auch
Referenzen
- ^ „Subnationale Bevölkerungsschätzungen – Aotearoa Data Explorer“ . Statistics New Zealand . Abgerufen am 29. Oktober 2025 .
- ^ a b „Gesamtzahlen nach Themen für Einzelpersonen (RC, TALB, UR, SA3, SA2, Ward, Gesundheit), Volkszählungen 2013, 2018 und 2023 | Aotearoa Data Explorer“ . explore.data.stats.govt.nz/ . Abgerufen am 3. Oktober 2024 .